
Load Testing Authentication: Why IAM Is Not a Regular API
 Buket Çoban · DevOps Engineer
TL;DR
- Load testing authentication with a constant pool of virtual users (VU) cannot establish an arrival-rate capacity claim on its own. Throughput is pinned to your concurrency divided by your cycle time, so a slower server produces a slower test rather than a queue.
- The size of your seeded realm decides how much of it can stay resident in cache, and so how often a user lookup reaches the database. Keycloak's local caches default to 10,000 entries.
- Password hashing dominates login cost. Keycloak's own guidance puts one vCPU at about 15 password logins per second, against about 120 refresh requests per second.
- Endpoint mix is a test result, not a script detail. Shifting traffic between login and refresh changes measured capacity while the request count stays the same.
- Publish the conditions with the number: load model, endpoint mix, seeded counts, cache sizes, hashing parameters, token lifetimes, and the measurement window.
The first setting: your load model answers for the server
A load test can report a healthy system and be describing your test harness instead of your server. Load testing authentication means measuring the endpoints that issue and renew credentials, and it fails in ways a business API does not. Here is the first way it bites you.
Run a fixed pool of virtual users against an authentication service and slow the service down, by any means you like. Throughput alone will not tell you how far the server is from its limit, because under constant concurrency it is tied to your own concurrency and cycle time. Cycle time means response time plus any pause the script adds between iterations. A fixed pool of clients only sends a new request once the last response arrives. So the offered load falls as the server slows, and the work outstanding at any moment stays bounded by your virtual user count. Requests can still queue inside that bound, but the test cannot hold an arrival rate the server is failing to keep up with. The throughput number you write in the report is your own concurrency setting divided by your own cycle time. The server never got asked for more.
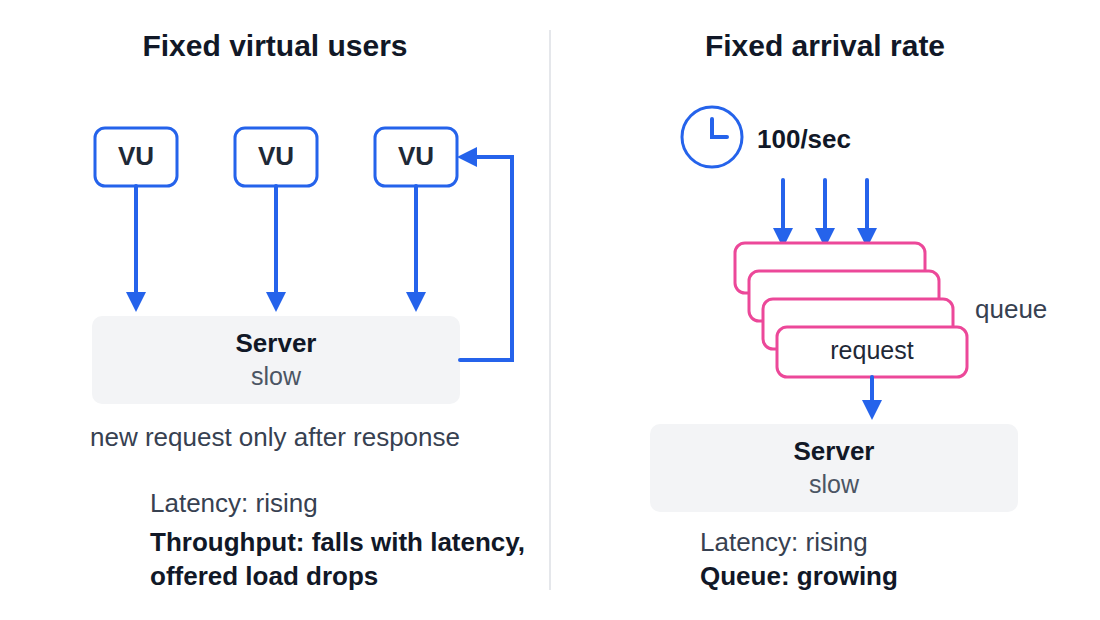
The same slow server, measured two ways. Blue marks the request path, pink marks requests waiting in a queue. Only the arrival-rate model keeps offering work the server cannot absorb.
That is the first of two settings that decide the result before Keycloak does anything. Before the second, it is worth being clear about what the number is meant to protect.
Load testing authentication against a real objective
Keycloak publishes example service level objectives for teams to adapt. Ninety-five percent of authentication requests under 250 ms, and server errors below 0.1 percent, both measured over 30 days.
A load test that cannot detect a breach of either number is not protecting anything. It is producing a report.
The second setting nobody writes down
The other setting is the size of the test user pool, and it is the one that catches people who already know about the first.
Keycloak's user cache holds a fixed number of entries. Draw your test users from a pool that fits inside it and, once the cache is warm, most lookups are a read from a map in memory. Draw from a pool far larger than it and only a small fraction stays resident. The same lookup then often becomes a database query, an entity graph, and an ORM round trip. Same server, same request rate, same script. The only thing that changed is a number you chose when you seeded the realm.
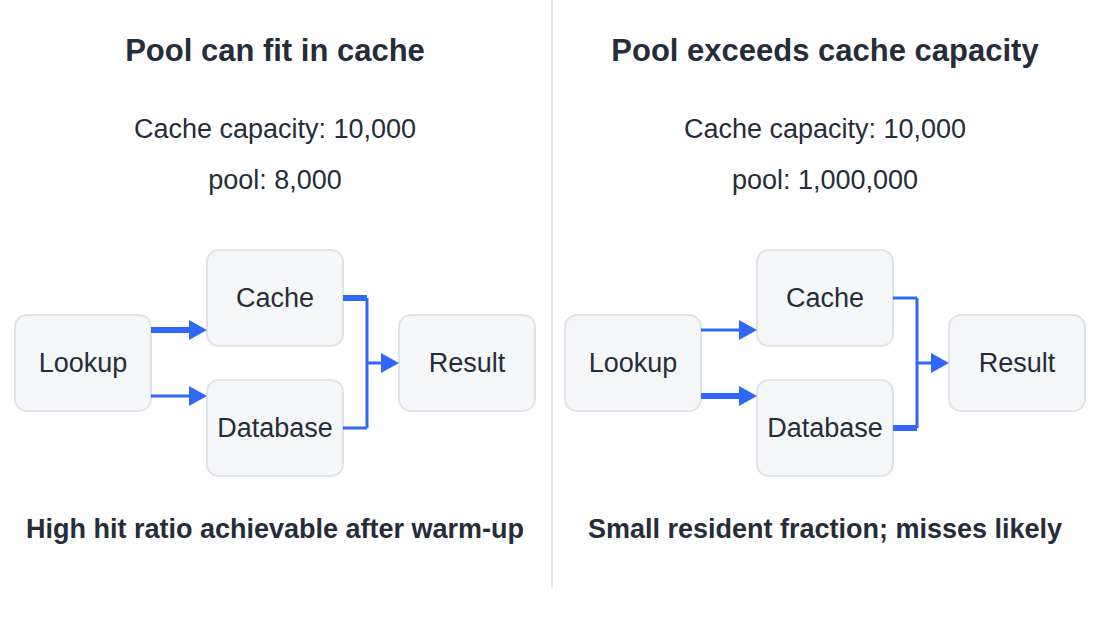
Same request, same server. Both panels show a lookup that can reach either the cache or the database. The thicker line marks the path most lookups take once the cache is warm and users are drawn roughly evenly from the pool. Uneven access, eviction and per-node cache locality all move that balance.
So a team can run the load model correctly and still publish a figure that says more about their seed data than about their deployment.
Neither setting normally appears in a load test report. A reader who wants to check your number cannot, and a reader who disagrees with it has nothing to point at. That is the part worth fixing, and it costs nothing but a paragraph.
How we misread our own benchmark
We did not work this out from first principles. We ran a cache ablation benchmark for the Keycloak community and published the findings in discussion #48573. Then we looked properly at the instrument rather than the result.
The benchmark itself used a fixed pool of virtual users on purpose. The question was what turning a cache off does to latency, and holding concurrency constant while changing one variable is a reasonable way to ask that. It answered the question it was designed for.
What it could not do was tell us anything about capacity, and for a while we read it as though it could. The throughput column moved far less than latency did, which is what a fixed-concurrency test produces when the server slows down. We were reading a property of the harness as a property of the server.
The trade-off we accepted is that the two questions need two instruments. An ablation study wants concurrency held still. A capacity claim wants arrival rate held still, so that a slowing server shows up as a queue instead of as a longer cycle time. We now run both, and the useful discipline was learning to say which one a given number came from.
What the measurements actually show
Take the user pool first, because there is a published number for it that most people have read past. Keycloak's sizing guidance states a condition of its own results: the tests ran with local caches at the default of 10,000 entries, against a realm of one million users. Not all users fit in cache, so some requests went to the database. The project is telling you that its headline figures were measured at roughly one percent cache coverage.
That is not a flaw in the guidance. It is a disclosure, and it is the disclosure most load test reports leave out. The same page gives the matching rule for clients. Past roughly 2,500 distinct clients in concurrent use, client data no longer fits the default caches, and the database may become the bottleneck. Where that happens the answer is to resize the cache, not to add CPU. Working set against cache size is what moves the bottleneck, so it belongs in the report. The server is the same either way.
The hashing parameter is the other half. Keycloak's sizing guidance puts one vCPU at about 15 password logins per second, measured on its own reference setup with the default Argon2 parameters. Separately, in a Keycloak discussion about high-volume logins, one operator reported roughly 50 password logins per second per vCPU with hash iterations reduced to 1. With password checking disabled altogether they measured roughly 125. Those are two different environments, so the figures cannot be normalised into a single ratio. What the operator's own before-and-after does show is that the hashing parameter moves the number a long way, and it rarely appears in a published result.
Now put them together. A fixed pool of virtual users pins your throughput to concurrency divided by cycle time. The size of your seeded realm decides how much of it can stay resident in cache, and so how often a lookup reaches the database. Neither is your server. Hashing is your server, but it is a setting rather than a capacity, and it is just as absent from most write-ups.
Which is why the useful output of a load test is not a number. It is a number plus the conditions that produced it, published together, so that a reader can either reproduce your result or tell you precisely where they disagree.
This is not a Keycloak problem
Both settings would bite on any identity provider, because they follow from what authentication does rather than from how Keycloak implements it.
Start with cost. A business API tends to have endpoints that cost roughly the same order of magnitude to serve. An identity provider does not. Keycloak's own sizing guidance puts one vCPU at about 15 password logins per second, but about 120 refresh token requests per second and about 120 client credential grants per second. That is an eightfold spread, and it follows from Keycloak's tested configuration and hashing policy rather than from the specification. A password-based user login has to run a deliberately expensive key derivation function, because that is what makes a stolen password database worth less. A refresh does not hash a user password, though it still validates the refresh token and any client authentication the flow requires.
So the mix you send is the test. Move five percentage points of your traffic from refresh to login and you have changed the measured capacity while the request count stays identical. Most teams pick that mix by intuition. It can be measured instead: Keycloak exposes the real ratio through the keycloak_user_events_total counter, and the true count of password verifications through keycloak_credentials_password_hashing_validations_total. The hashing counter comes with metrics enabled, but the user event counter needs its own flag on top of that.
Then there is state. A stateless REST endpoint does the reads and writes the test author asked for. An identity provider has to create session state on login, and where that state lives decides whether the write reaches your database. Keycloak 26 defaults to persistent user sessions, stored in the database with an in-memory cache in front, which the project describes plainly as lower memory usage and higher database usage. The same page documents in-memory and external Infinispan alternatives, so this is a configuration choice rather than a property of every identity provider. Enable refresh token rotation and the cheapest high-volume operation in your mix starts writing too.
And token lifetime decides the shape of all of it. An access token's expiry is the interval between forced round trips to the identity provider. For a client that stays active and refreshes at expiry, halving it doubles refresh traffic without changing login traffic at all. That raises your requests per second while lowering the average cost of a request. Idle clients, shorter sessions and refresh token rotation all change that ratio. Report throughput without reporting the token lifetime and the mix, and the number cannot be reproduced by anyone, including you.
None of that is specific to Keycloak. Any identity provider that hashes passwords, issues tokens with expiry, and keeps session state behaves this way. A load test that ignores that measures something other than what it claims to.
What to publish with a result
If you take one thing from this, take the disclosure list. Alongside the number, publish the load model and its parameters, the endpoint mix as executed, and the seeded user and client counts. Publish the configured cache sizes, the password hashing algorithm and its parameters, and the token lifetimes. Publish the measurement window as absolute timestamps. Say which portion of the run was warm-up and whether you excluded it. Say whether your percentiles were pooled across load generators or taken as the maximum.
That list is longer than most people expect, and every item on it is something that changed a result for us at least once.
Load testing authentication well is mostly this: knowing which of your own settings the number is really describing. The rest is running the test, which was never the hard part. It is the same discipline we needed when we tuned a Keycloak migration pipeline to 12 million records per hour. It is also why we care about what it takes to load Protobuf schemas into Keycloak's embedded Infinispan.
Running Keycloak under real load?
Keymate ships a production-grade Keycloak image with JVM tuning, clustering and health probes already wired in, so the deployment you load test is the one you run. Talk to us about running it in your stack.
Stay updated with our latest insights and product updates